
DataVision
“A pro platform for market research — fundamentals, technicals and AI analysis.”
A single analytics product: dashboards, fundamentals and technical research, an OI analysis tool, paper trading, and a Perplexity-backed AI layer.
- Sector
- Analytics / IT
- Engagement
- 2026
- Scope
- Single product
Overview
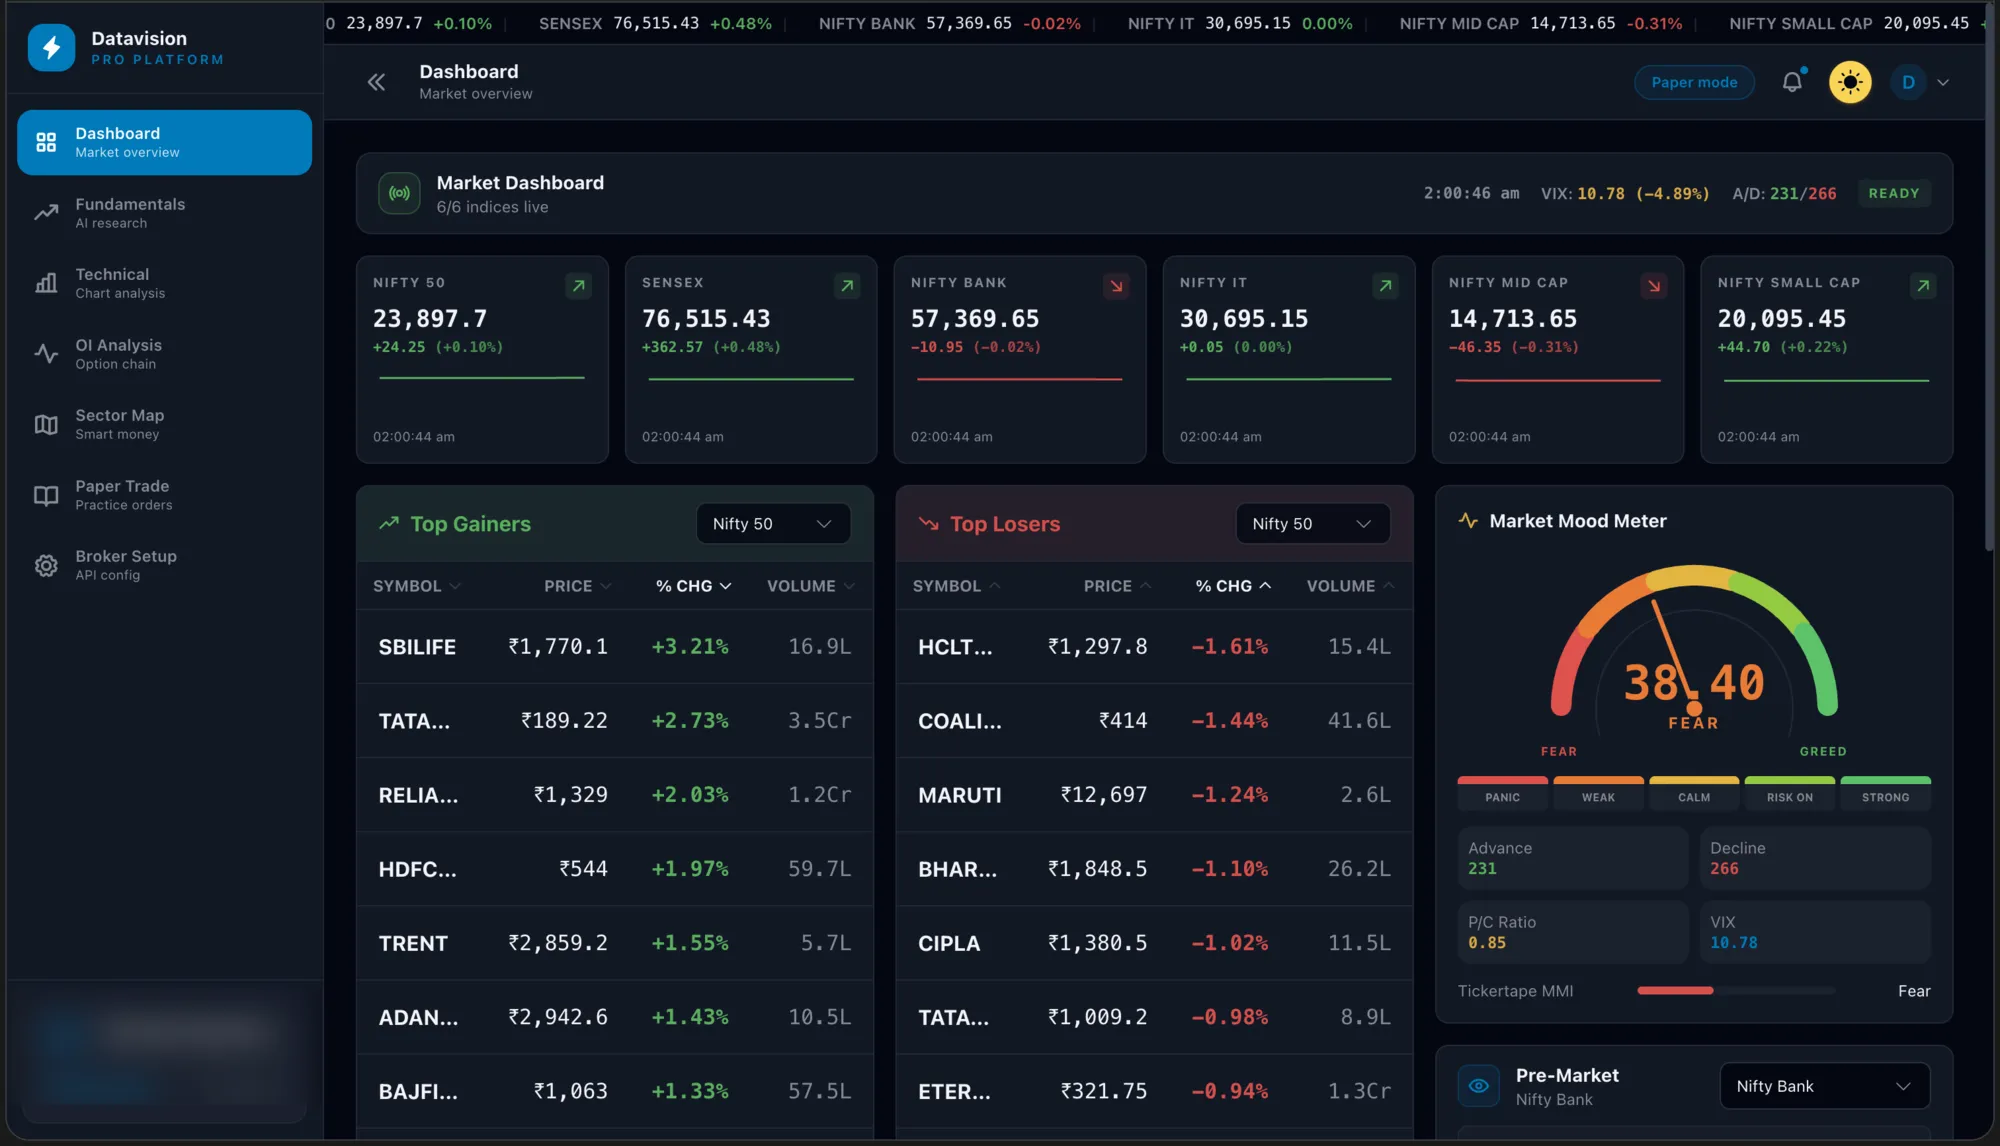
A scoped, single-product build. DataVision is a Vite/React SPA on a Flask API that gives traders a market dashboard, deep fundamental and technical research screens, an option-chain (OI) analysis tool, a sector map, and a paper-trading environment.
The distinctive piece is the AI analysis layer: the backend compacts source data, enforces a JSON schema on the model's response, parses it and normalises a fallback — so the AI output is structured data the UI can render, not a wall of text.
The brief
A research product, scoped to one thing
DataVision is a scoped, single-product build: one Vite and React app on one Flask API. It gives traders a market dashboard, deep fundamental and technical research screens, an option-chain analysis tool, a sector map, and a paper-trading environment — a research desk, not a broker.
In 96 days it went from an initial commit to a measured 26,825 lines across one frontend, one backend and six MongoDB collections. The last commit before we wrote this was 'datavision ai added' — the AI layer is the newest and most interesting part.
Architecture
An SPA, an API, and a data-provider proxy
React 19 on Vite, with Redux Toolkit and Jotai splitting state, Recharts for the charts and Radix for the primitives. A Flask-RESTX API over MongoDB with JWT auth. The front end deploys on Vercel; the API runs under Gunicorn with a gthread worker behind systemd.
Every market-data call goes through a provider proxy that attaches a service key and checks the caller's subscription before the request leaves the server. The data vendor never sees an end user, and entitlement is never trusted from the client. Live index quotes arrive over Socket.IO and are merged into existing state, so the dashboard updates without flashing on every tick.
The AI layer
AI analysis as structured data, not a wall of text
Most products that bolt an LLM onto a stock screen paste its reply into a div and call it a feature. DataVision doesn't. The AI analysis service builds a prompt, compacts the source data so it fits the model's context window, and then enforces a JSON schema on the response — parsing it, and normalising a fallback when the model deviates from the shape it was asked for.
So 'AI fundamental analysis' and 'AI technical analysis' come back as typed objects: a verdict, a set of supporting points, risk flags, each in its own field. The frontend renders those into cards it can style and trust. The model is Perplexity; the discipline is the product.
The AI response is parsed against a JSON schema, with a normalised fallback when the model deviates — so it renders into cards the UI can trust.
The research surfaces
Fundamentals, technicals, and a chain that colours itself
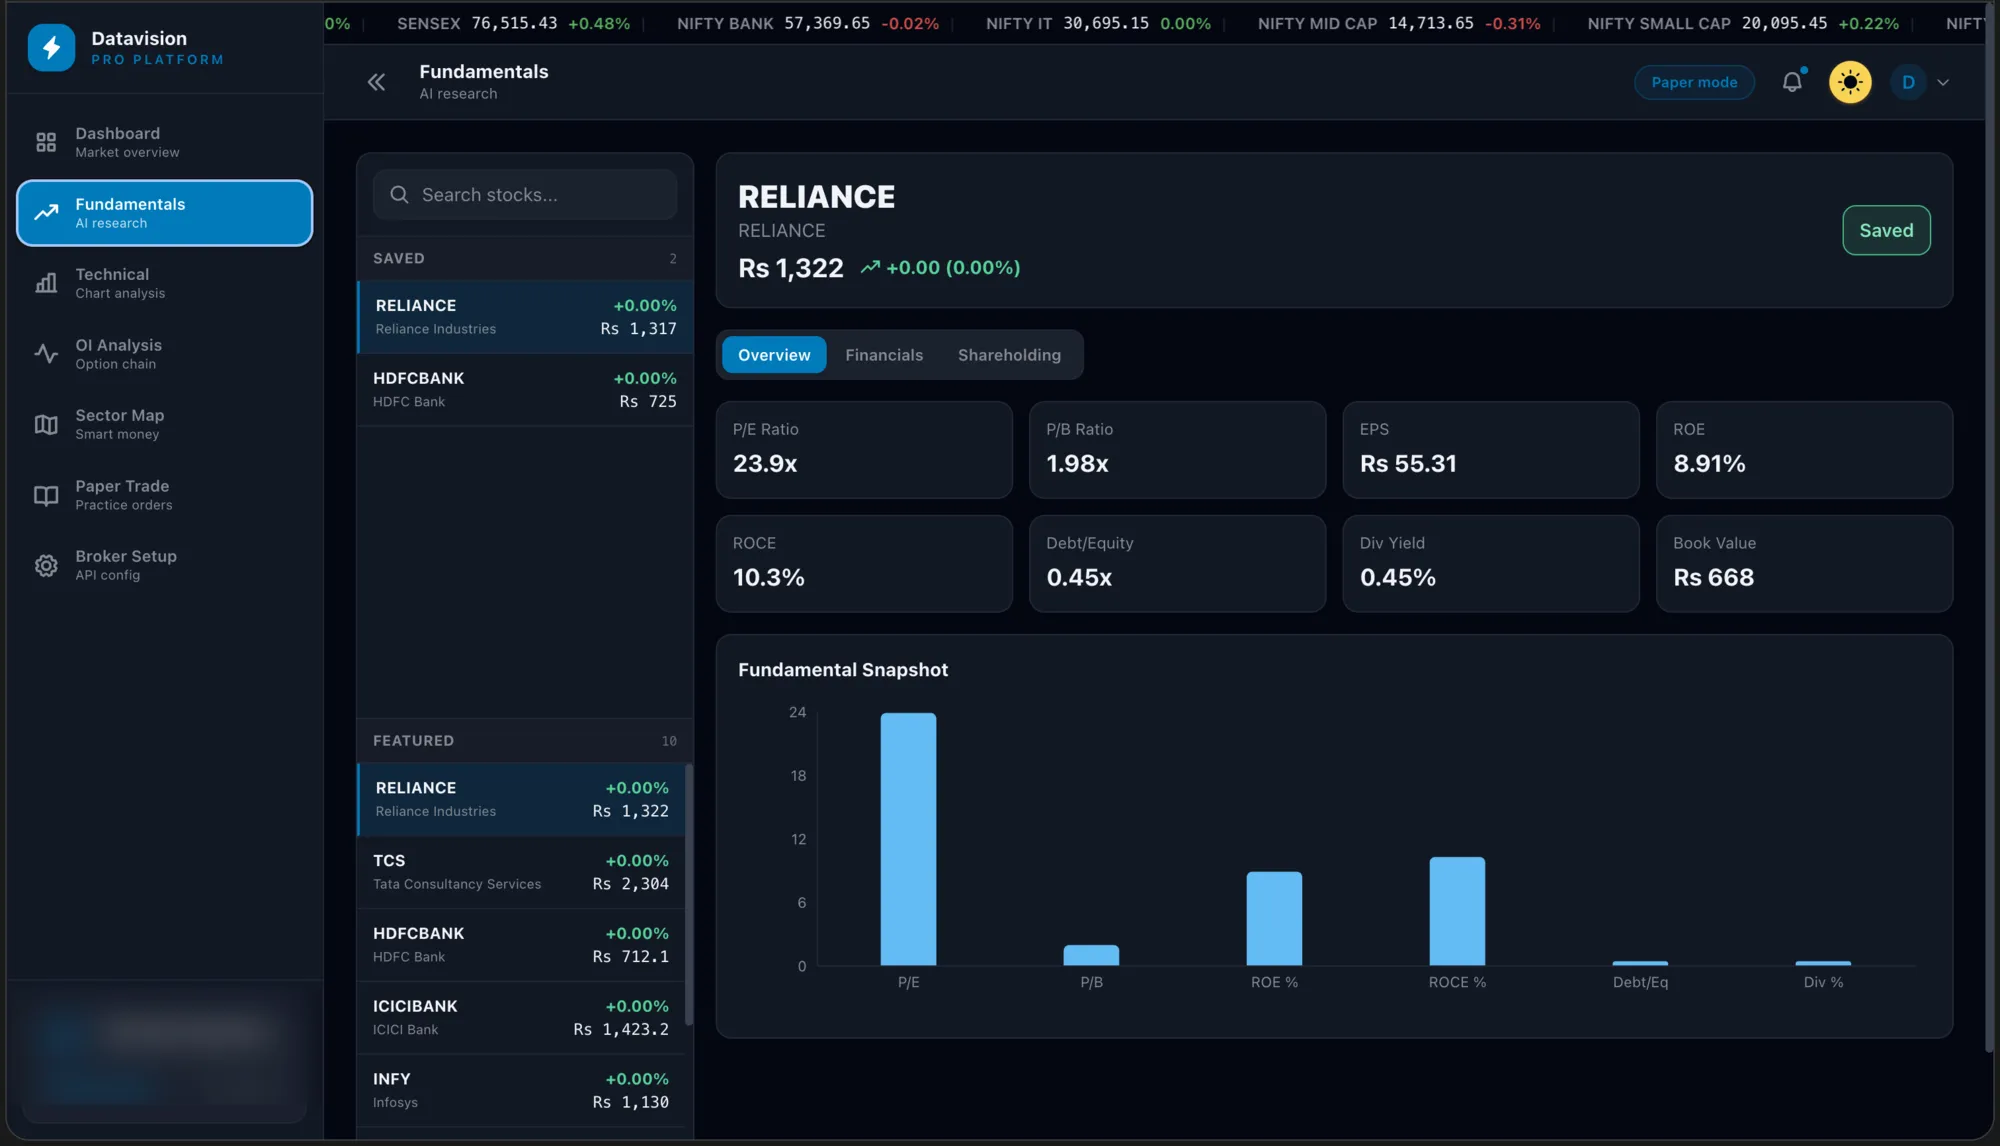
Fundamentals carries a stock search and watchlist, a grid of company metrics — P/E, P/B, EPS, ROE, ROCE, debt-to-equity — quarterly revenue and profit charts, and the AI tab. Technicals is interval-driven: indicators, pivots, chart-style trend analysis, and its own AI tab.
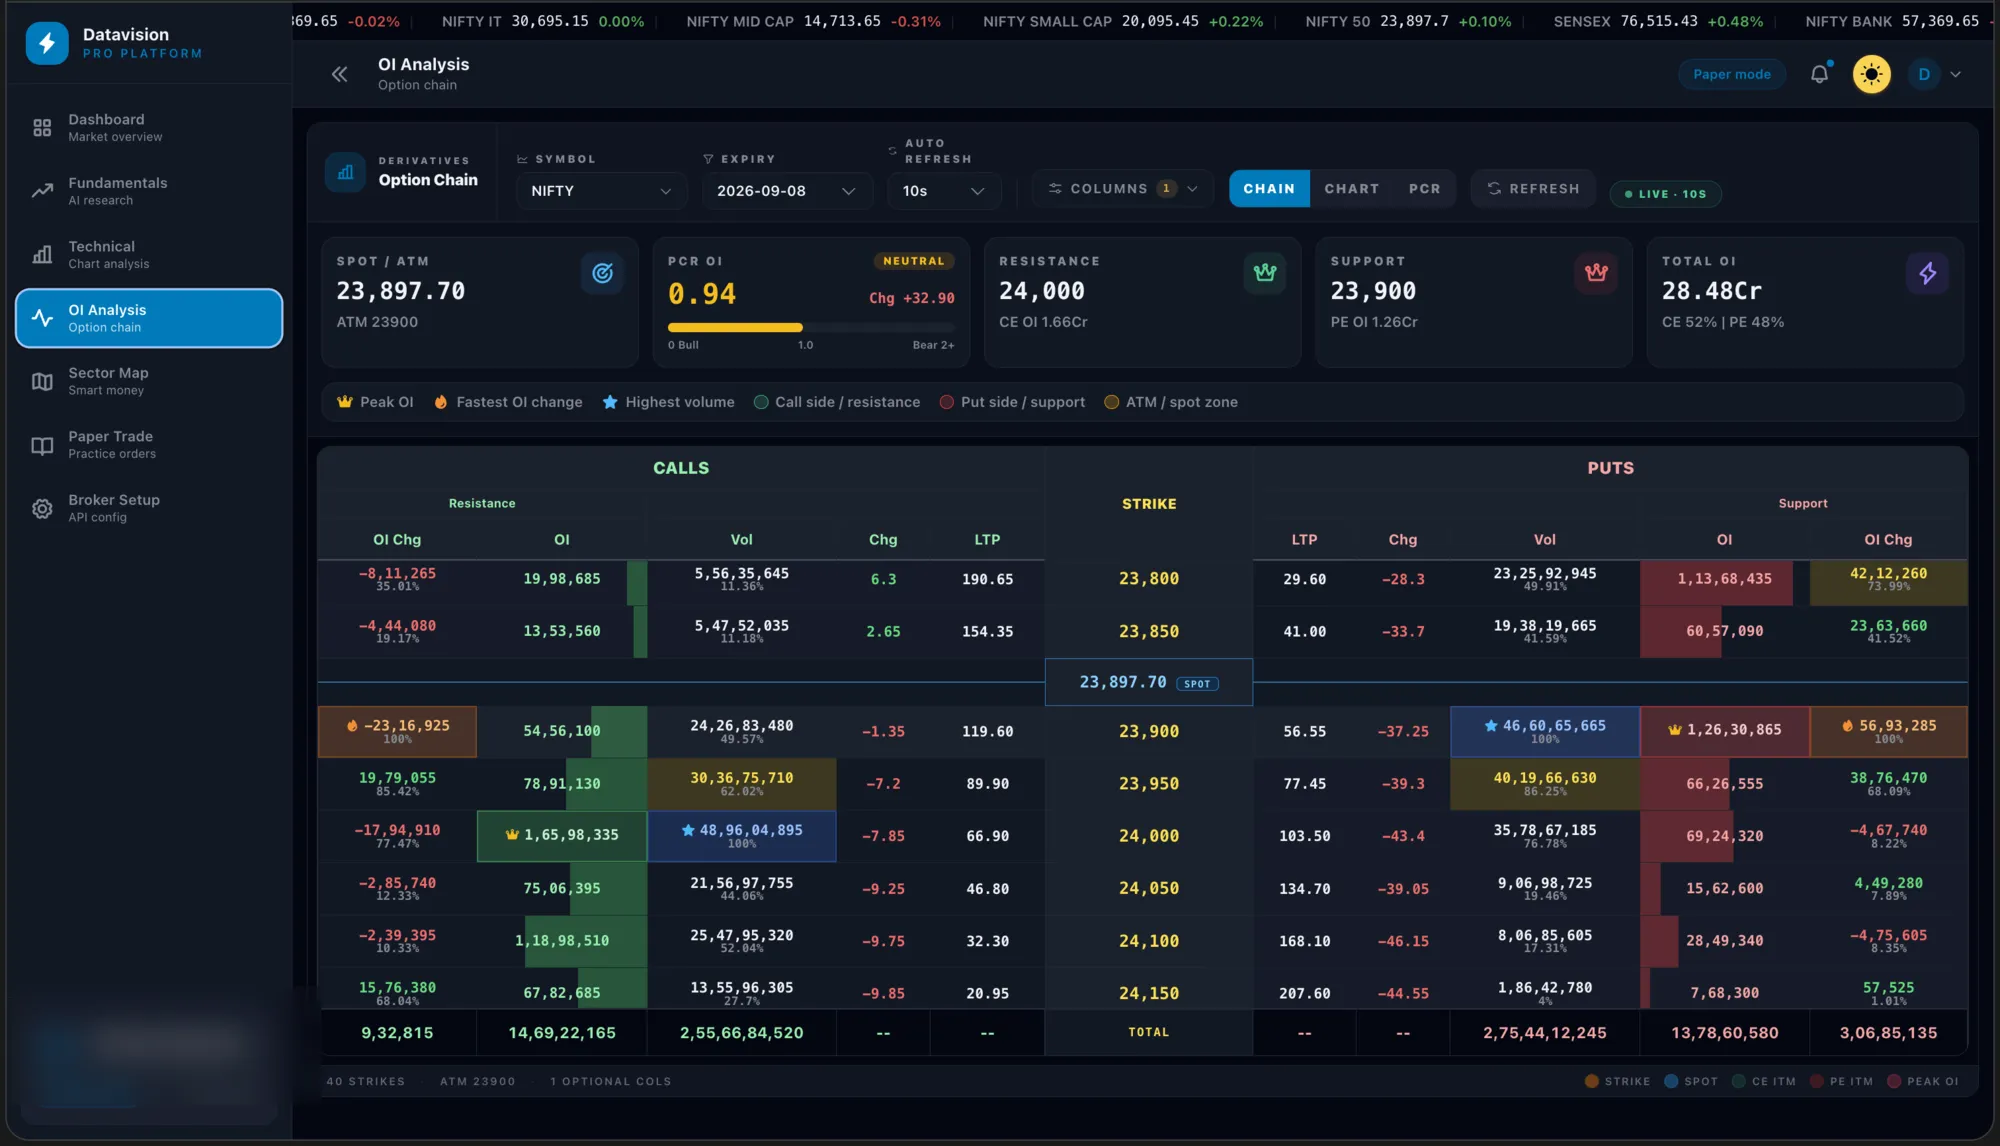
OI Analysis is the densest surface. CE and PE columns with open interest, OI change, LTP, volume, PCR, implied volatility, the Greeks, and intrinsic-versus-time-value toggles — and a set of derived colour buckets computed on the client from the raw chain: peak OI, fastest OI change, highest volume, call-side resistance, put-side support, ATM zone. The provider returns numbers; the app returns a read.
Ingestion
Webhooks that answer immediately
A Chartink webhook feeds DataVision's screener store. When a scan fires, Chartink posts the payload; the endpoint parses it, extracts the trend, normalises the timestamps and dates, and persists the rows on a background thread — so the webhook acknowledges in milliseconds and never holds the connection open while it writes.
It's a small thing. It's also the difference between an integration that scales and one that starts timing out the first busy morning.
The engineering you don't see in a demo.
AI output as structured data
The AI analysis service builds a prompt, compacts the source data to fit, enforces a JSON schema on the response, parses it, and normalises a fallback when the model deviates — so 'AI analysis' is a typed object the frontend renders into cards, not free text pasted into a div.
A market-data proxy with access control
Requests are forwarded to an external data provider with a service key and a subscription check on every call, so entitlement is enforced server-side and the vendor never sees end users.
Webhook ingestion off the request path
The Chartink webhook parses screener payloads, extracts trend, normalises timestamps and dates, and persists rows on a background thread so the webhook responds immediately.
What it runs on.
Measured from the repository, not the pitch.
Against the baseline.
Reported as change against the engagement baseline. Search figures stay as percentages and multiples on purpose — absolute volume tracks DataVision's news and category cycle, so the relative move is the honest measure.
Scope, stack, scale and the engineering above are drawn straight from DataVision's codebase and git history.
The takeaway
One product, and one idea worth copying
96 days, one team, one research product. The part to take away is the AI layer: a method for turning a probabilistic model into typed data a UI can render and a user can trust — schema-enforced, fallback-normalised, no free text.
That approach isn't specific to trading. It's how any LLM feature should be built.